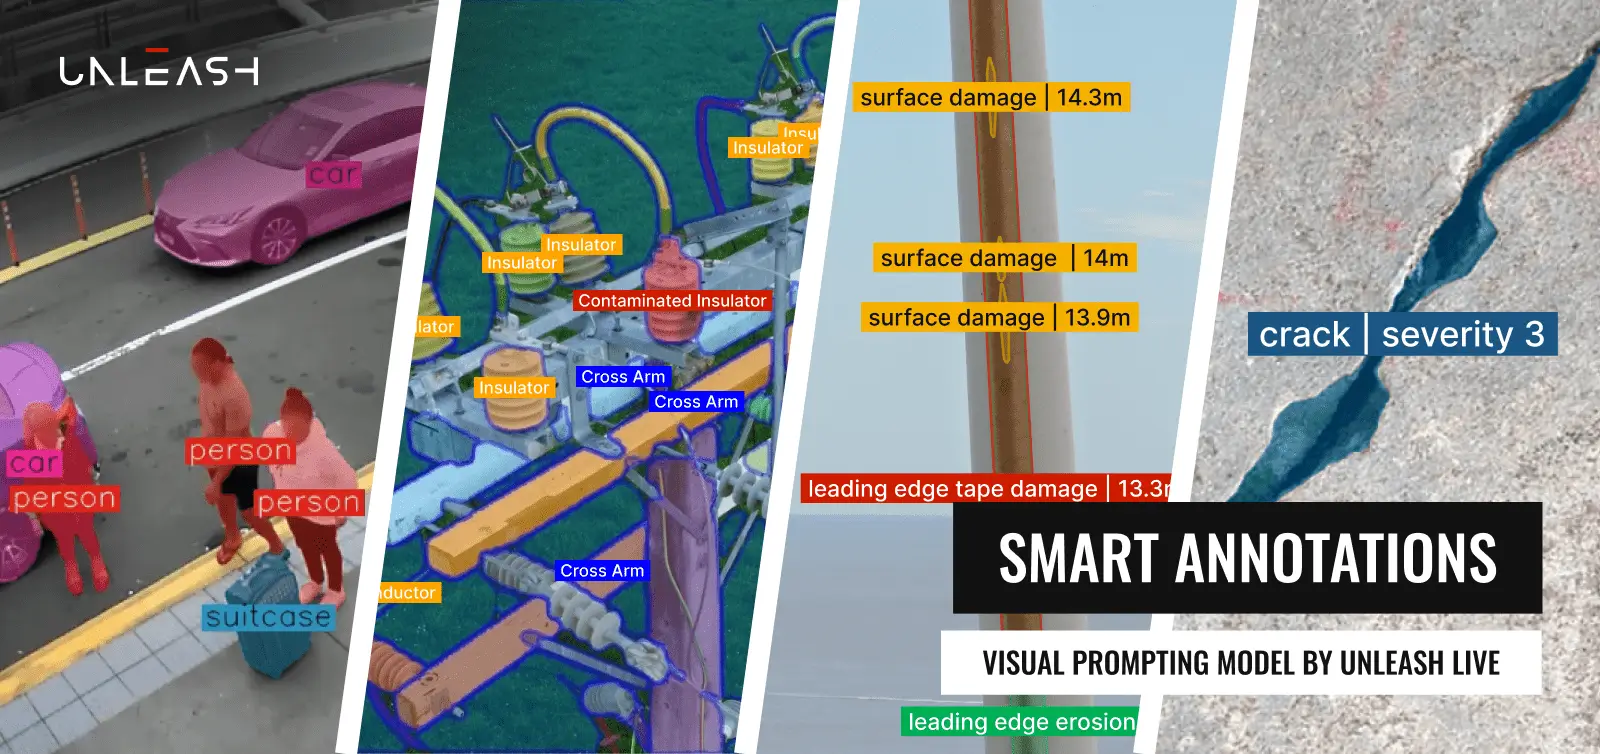
The Unleash live platform is a robust tool that applies AI computer vision models to live camera feeds, enabling high-performance analysis of HD video streams at up to 60 fps in real-time. This technology offers energy, utilities, transport, resource and infrastructure owners such as airports and public safety authorities unparalleled insights into their operations.
Unleash live not only performs live streaming but also captures meaningful data using hundreds of AI Apps within the platform. These can be visualized to extract valuable insights, empowering our customers to build custom insights from powerful camera analytics. These insights cover critical use cases such as:
- Crowd movement
- Traffic flow
- Traffic congestion
- Zone utilization
- Parking utilization
- Curbside management
- Queue analysis
- Multi-modal transport analysis
- Security zone breach analysis
- And many many more.
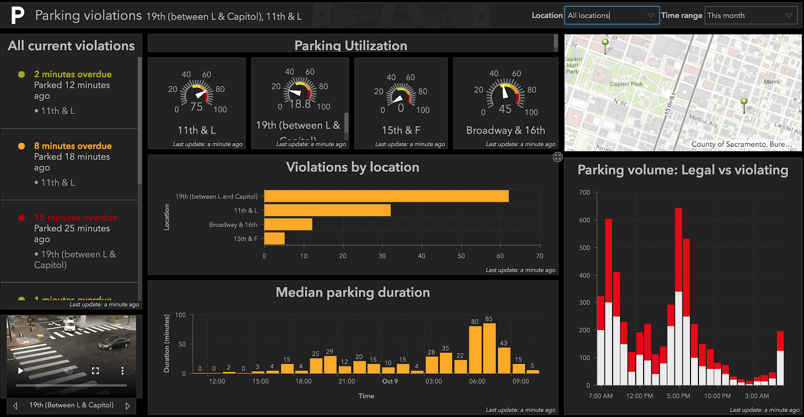
Live Customer Dashboard for Parking Violations
Esri’s ArcGIS online provides state-of-the-art dashboards to display such data in real-time. This blog post provides a high-level overview of how we integrated Unleash live AI analytics with Esri Dashboards to enhance our customers’ decision-making processes. To learn more about a real-world application, check out our partnership with the City of Sacramento, California, USA.
Online offers state-of-the-art dashboards to display such data in real time.
This blog post shares a high-level overview of how we integrated Unleash live AI. Analytics with Esri Dashboards and how it improves our customer’s decision-making. If you want to learn more about a real-world problem we solved, read more about our partnership with the City of Sacramento, California, USA.
The Raw AI Data Challenge
Unleash live can perform near to zero latency live stream and process the stream via AI and Machine learning technology in real time over the cloud or Edge with maximum inferences per second, generating a tremendous amount of information. Our customers often require consolidated custom insights to identify trends or extract specific insights over time.
To address this, we post-process all AI data in a serverless and highly efficient cloud computing or Edge setup. Once cleaned and piped through an API, Esri receives accurate and meaningful data for insightful presentations.
Esri’s ArcGIS Online Dashboards
Many of our customers already use Esri ArcGIS Online and prefer to maintain their existing insights gathering and presentation workflows. Unleash live seamlessly integrates into this workflow.
A key functionality our customers appreciate is the ability to display any type of data on Esri dashboards. The typical workflow involves preparing a CSV file on Unleash live, uploading it to the Esri platform, and then building a custom dashboard based on the imported data. This method works for visualizing static data, but our goal was to enable live data visualization, unlocking numerous valuable use cases.
ArcGIS Online is fed from a REST API, so we collaborated with Esri to simplify the process of feeding newly generated live data into the system. The Esri API, which has a Python wrapper, facilitated this integration.
Integration
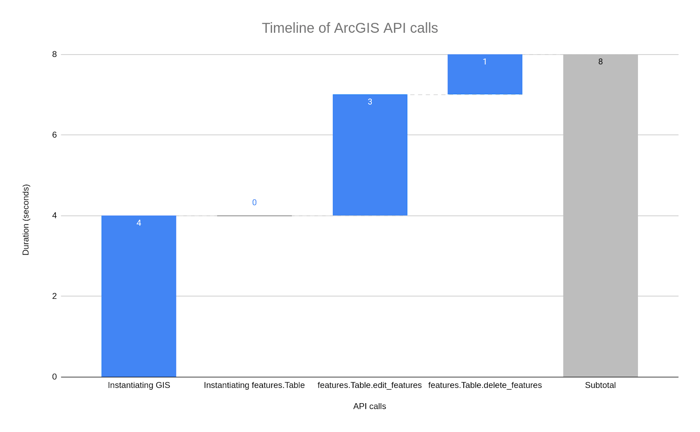
We adopted an incremental approach to achieve minimal viable functionality quickly before refining it. Initially, we automated the process of generating the CSV and uploading it through the API.
Our close partnership with Esri allowed us to reduce latency quickly for API calls, reducing the execution time by upto 8 seconds. These 8-second executions worked well with flushing the queue every 10 seconds.
Dashboarding
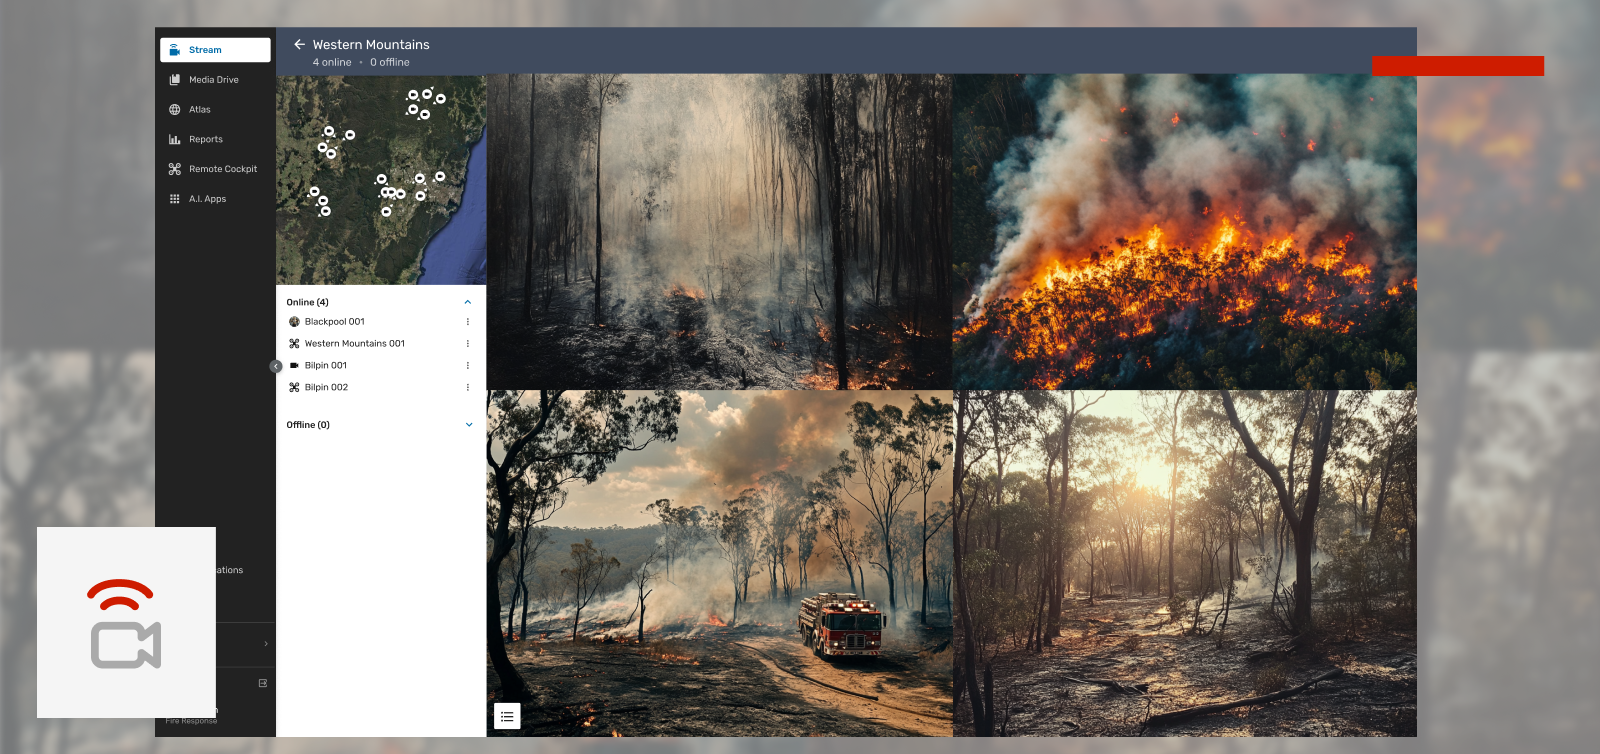
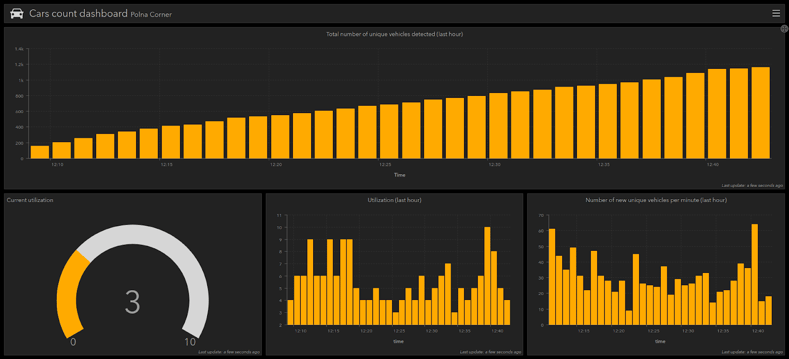
With our optimized API architecture in place, we crafted dynamic Esri dashboards that are fueled by real-time AI insights from Unleash live. Users can now seamlessly visualize data from various streams concurrently, providing them with a near-live snapshot of the past hour's activities.
Conclusion
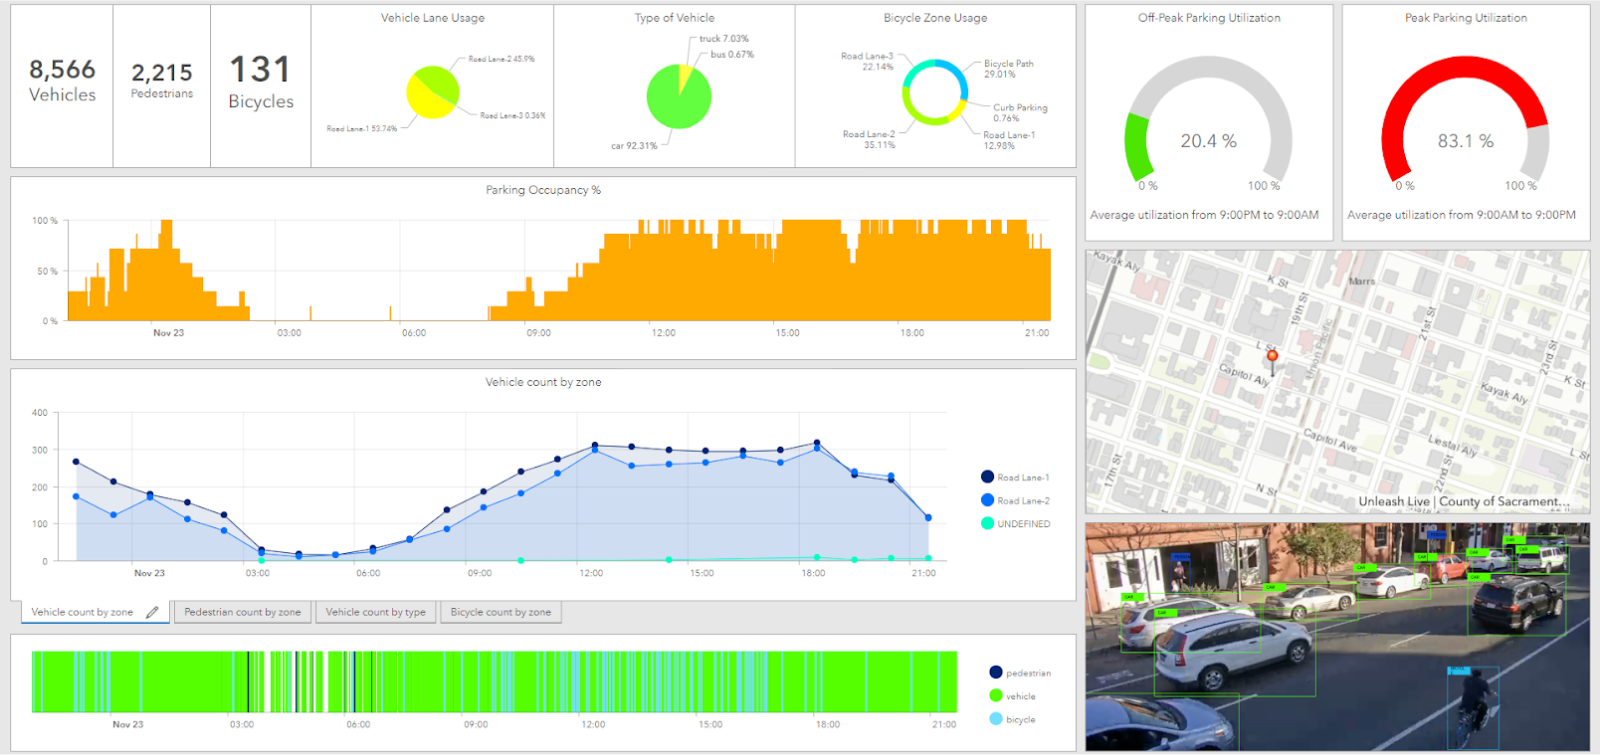
Visualizing data on dashboards provides powerful insights to end-users. Data that appears mundane in a CSV file comes to life when visualized live, revealing patterns or trends that might otherwise go unnoticed. At Unleash live, we understand the value of data visualization and enhance it by feeding dashboards with data from AI-powered video analytics.
For example, using a smartphone camera with an overlaid AI model set up on Unleash live in seconds, we created a comprehensive dashboard.
Q&A
Q: What makes Unleash live’s platform unique for data visualization?
A: Unleash live provides real-time AI analysis on HD video streams, which can be visualized through Esri Dashboards to deliver unparalleled insights for various critical use cases.
Q: How does Unleash live integrate with Esri’s ArcGIS Online?
A: Unleash live integrates seamlessly with Esri’s ArcGIS Online through a REST API, allowing for the visualization of live AI data on Esri dashboards, enhancing decision-making processes.
Q: What types of insights can be derived from Unleash live’s AI analytics for Traffic solution?
A: Insights span various use cases, including crowd movement, traffic flow, zone utilization, parking management, curbside management, and security zone breach analysis.
Q: How do zone-specific alerts improve resource management?
A: Zone-specific alerts enable timely responses to anomalies within designated areas, improving the allocation of resources for public safety and event management.
Q: What are the benefits of using Unleash live with Esri dashboards for city planners and public safety officials?
A: Benefits include real-time data visualization, improved accuracy in data capture, the ability to set zone-specific alerts, and seamless integration into existing workflows for more informed decision-making.
Get Started with Unleash live
Visit unleashlive.com to learn more, or book a time with one of our specialist team members to learn how your business can take advantage of live-streaming video and AI analytics.