Why thermal data belongs inside your inspection record
Every piece of infrastructure has a temperature. Transformers run warm under load. Electrical connections heat up when current meets resistance. Solar panels with failing cells generate hotspots that look identical to functioning ones from the outside, but tell an entirely different story in infrared.
Thermal imaging makes that story visible
It is not a more sophisticated version of photography. It is a different category of observation. A standard camera captures reflected light. A thermal camera captures emitted heat, translating the infrared radiation from a surface into a temperature map of that surface. Two assets that look identical to the eye can tell completely different stories in thermal: one running normally, one approaching a failure mode that no visual inspection would ever flag.
That distinction matters enormously in asset-intensive industries, and it shapes how inspection programs in utilities, renewables, oil and gas, and mining are increasingly structured.
The faults that only heat reveals
Visual inspection has a firm ceiling. It confirms presence, damage and gross physical deterioration. It cannot confirm whether a component is operating within its thermal parameters. That gap is where thermal imaging earns its place in a maintenance and inspection program.
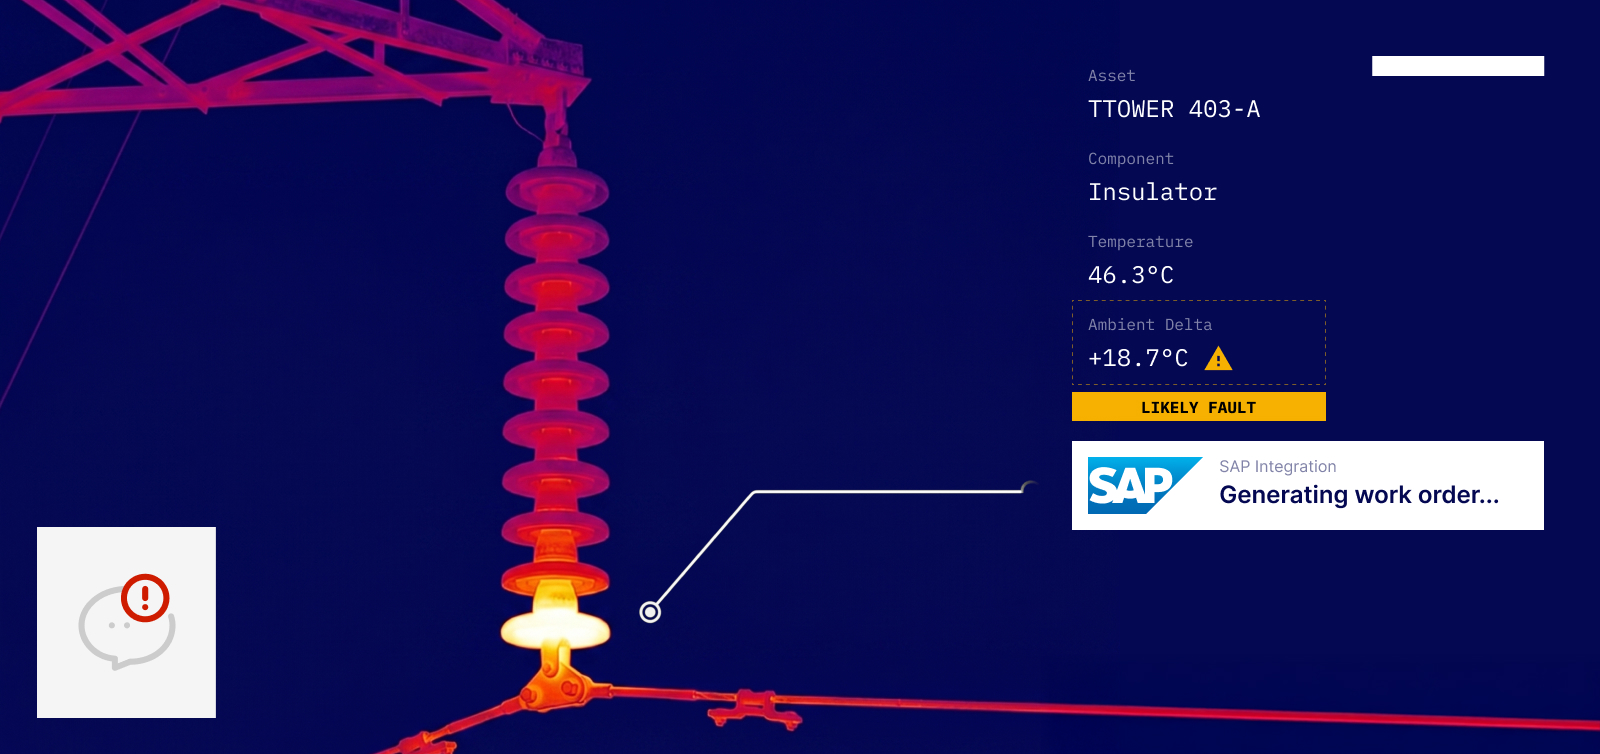
In electrical infrastructure, resistance anomalies in connections, insulators and switching gear produce localised heating long before they produce visible symptoms. A failing electrical joint on a distribution network may look unremarkable for months while running 68-104°F/20-40°C above its neighbors, gradually degrading insulation and heading toward an uncontrolled failure event. Thermal inspection, done on a regular cycle, catches the signature early. The intervention cost of tightening a connection or replacing a component at that stage is a fraction of what it costs to respond to an outage.
In solar energy, the failure modes are subtler but commercially significant at scale. Bypass diode failures and cell-level defects create hotspots that reduce energy yield from the affected string while the plant appears to be operating normally. A large solar farm running a degraded string for an extended period is losing revenue that has no obvious diagnostic trail in standard operational monitoring. Thermographic inspection of the panel array, typically from a drone-equipped inspection program, surfaces those anomalies directly. The difference between a functioning panel and a hot-spotted one is invisible in the standard RGB image (standard visual image) and obvious in thermal.
In oil and gas, thermal imaging supports heat exchanger performance monitoring, insulation integrity across pipeline corridors, and equipment thermal profiling on critical plant. In mining, electrical switchgear, motor windings, conveyor bearings and hydraulic systems are all candidates for periodic thermal inspection. A conveyor bearing approaching failure will betray that condition in its temperature signature before it betrays it in noise, vibration or visual wear. Catching it in the thermal image is the difference between a planned bearing replacement and an unplanned production stoppage.
How thermal inspection programs are structured
Modern thermal inspection programs in heavy infrastructure are typically executed in one of two modes.
The first is aerial, using drone platforms equipped with dual-sensor payloads that capture both standard high-resolution RGB and radiometric thermal images simultaneously. A single flight over a distribution corridor, a solar farm or a substation returns both datasets in one pass. The RGB images provide physical context. The thermal images provide condition data. For large-scale infrastructure owners running inspection programs across multiple sites, this dual-capture approach has become standard operating procedure.
The second mode is fixed or mobile ground-based, using handheld or tripod-mounted thermal cameras for close inspection of specific equipment such as switchgear panels, motor housings and heat exchangers. This is complementary to aerial programs rather than a replacement.
In either case, the result is a radiometric thermal image file: an image that contains not just a visual representation of the heat signature but the actual temperature data behind it. In the DJI ecosystem, these files are stored as R-JPEG format, embedding the radiometric data inside the image file in a way that can be extracted, measured and analysed.
The workflow problem that most inspection teams already recognize
Here is where the operational reality gets complicated.
Thermal data captured during an inspection has historically required a separate tool to analyse. DJI Thermal Analysis Tool has been the default for operators using DJI payloads. It is a Windows desktop application. It is capable. It also lives entirely outside the inspection management system where the rest of the inspection record lives.
That means: fly the mission, return to base, export the thermal files, open the desktop application, check spot temperatures, export the results, then return to the inspection platform to annotate and report. Every step in that sequence is a potential point of failure: version control risks if files are modified outside the governed record, time overhead added to every post-flight review cycle, and thermal evidence that exists in two systems rather than one.
For inspection programs running hundreds of flights per year across multiple sites, that round-trip is not a minor inconvenience. It is a structural inefficiency with a measurable cost in analyst time and custody risk.
What has changed
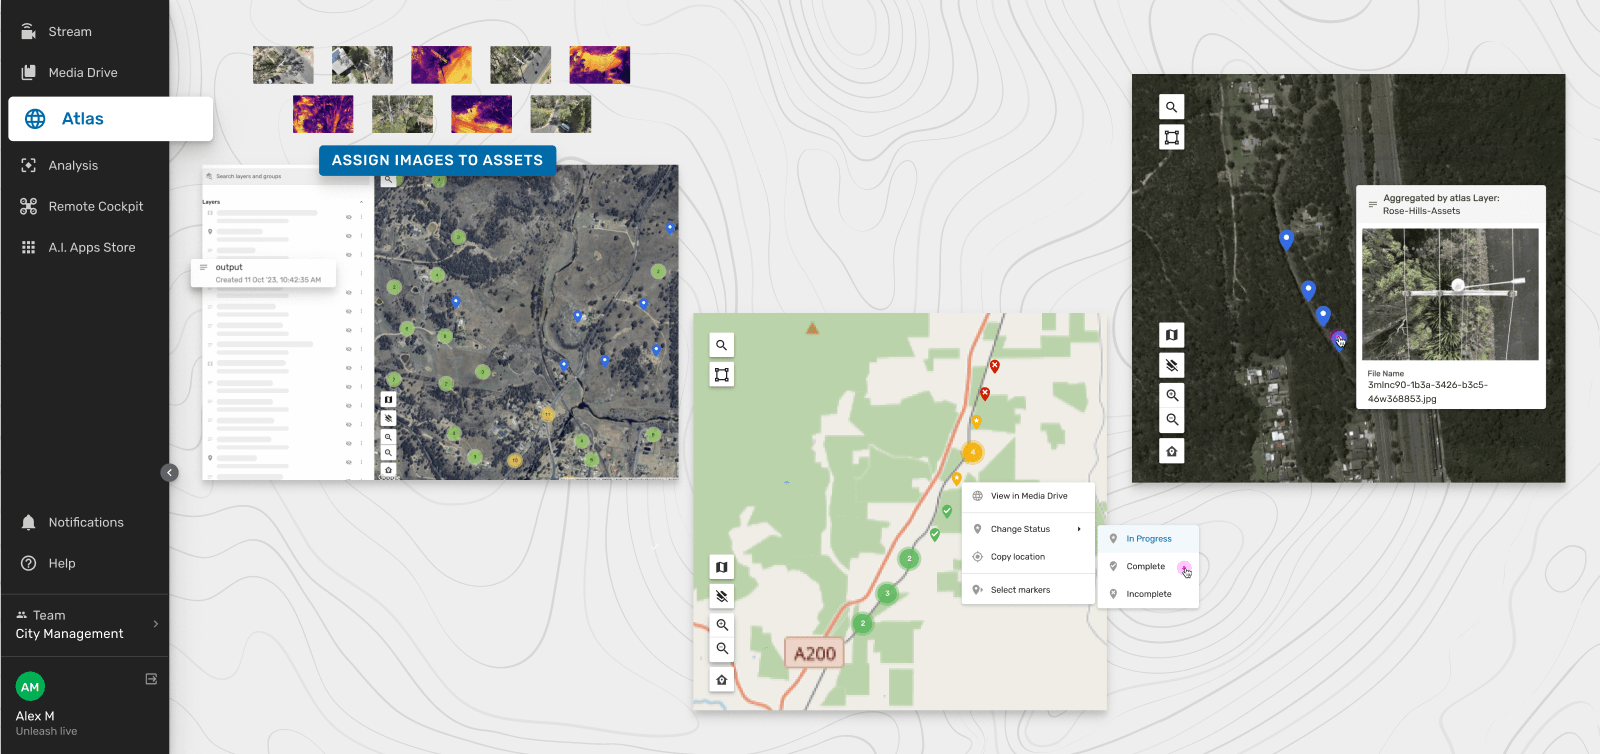
Thermal image analysis is now built directly into Orb, Unleash live’s drone based asset inspection product, via Image Viewer, the full-resolution image review and annotation interface the Cloud platform.
When a radiometric thermal image is opened from Unleash live’s media management and storage system, Media Drive, the thermal toolbar appears automatically. Inspectors can click any point on the image to read its temperature. Four visualization palettes are available: Ironbow, Rainbow, White Hot and Black Hot, each suited to different inspection contexts. Temperature readings toggle between Celsius and Fahrenheit. Standard annotation workflows apply to thermal images the same way they apply to standard RGB captures.
The thermal data stays inside the inspection record and is directly correlated to the asset inspection imagery used for AI based condition assessment. The annotation happens in the same system. The review and approval workflow is unchanged.
For inspection programs also running dual-sensor payloads where thermal and RGB images land together in Media Drive, a companion capability addresses the triage problem directly. The IR filter in Media Drive's Type dropdown isolates all thermal images in the current view instantly. Mixed datasets from a single flight, potentially hundreds of files combining RGB and thermal, can be filtered to thermal-only in one click, routed to the specialist reviewer, and processed without manual identification or secondary workflows.
Thermal images are automatically classified on upload using existing EXIF, XMP and camera metadata. No manual tagging is required.

Thermal image support in image viewer: select temperature unit, adjust calibration, pick thermal colour palette.
Why this matters beyond the feature
The most important thing thermal inspection returns is early certainty: confidence that a component is within tolerance, or clear evidence that it is not. That evidence is only useful if it is handled with the same rigor as every other piece of inspection data.
Thermal files that leave the inspection platform for analysis and return as screenshots or exported reports are not governed in the same way as images that remain in a single auditable record from capture through annotation through reporting. For infrastructure operators with regulatory obligations around asset condition monitoring and maintenance records, that distinction is not administrative. It is a compliance and audit consideration.
Keeping thermal analysis inside the inspection record means the evidence chain is intact. The temperature reading, the annotation, the reviewer, the date and the asset record are all in one place. That is the standard that enterprise inspection programs should be working toward, and it is now available without changing the inspection workflow.

Filter standard RGB images and thermal images in image viewer.
See it in your next inspection
If your team is running thermal-equipped drones and currently routing that data through a desktop tool before it comes back into your inspection record, that workflow can be consolidated. Talk to your Unleash live contact about enabling thermal review in Image Viewer for your next inspection cycle.